

Enough time has passed, and ‘The Stock Market’ has been around long enough that we’ve been able to gather some pretty good data about what works and what doesn’t work when it comes to investing – and what does the data tell us?
“Time in the Market is better
than Timing the Market”
Its an old saying and its kinda cheesy when people start whipping out Warren Buffet & Peter Lynch quotes, but its such sage advice that it would be remiss of me not to …so i’ll set my ego aside and get cheesy. This amazing piece of advice describes the fact that over the long term, through all of the lumps and bumps and booms and busts, the stock market has returned ~9% per year on average.
For a bit of context and colour, this includes:
- The 1987 Market Crash
- The Asian Financial Crisis – 1997
- The ‘Tech Wreck’ in 1999 / 2000
- The bombing of the world trade towers – 2001
- War on Iraq
- The GFC – 2008/2009
- The Euro crisis (actually a couple of them!)
- Brexit
- Countless oil market & commodities crashes
30 years of Asset Class Returns
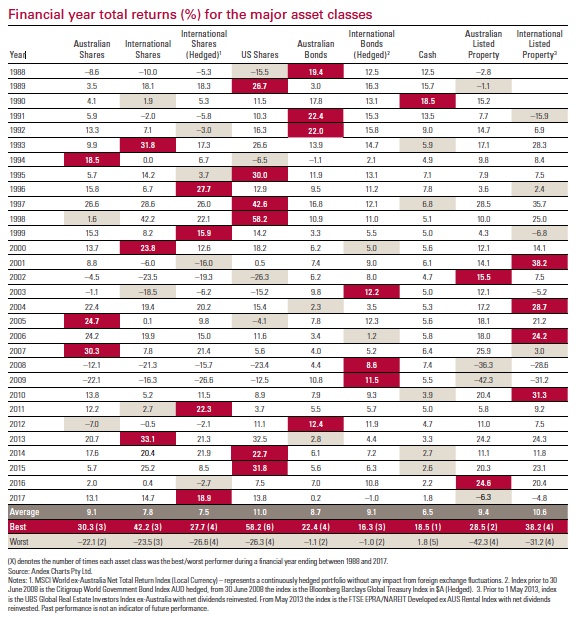
So how bad does it get when things go bad?
Well, during the biggest ‘crisis’ in recent history (the GFC in 2008) the Australian stock market suffered a 12.1% drop, and then to rub salt in the wounds, investors copped another 22.1% down draw in 2009. Youch right?
Funny though that people never talk about the amazing returns they made in the 4 years preceding the GFC
2004: 22.4%
2005: 24.7%
2006: 24.2%
2007: 30.3%
By anyones measure, that is pretty amazing!
So then why don’t you just stay is stocks when times are good, and stay in cash when times are bad? Well, a famous fund manager who averaged 29.1% return per year for 13 years doesn’t reckon its that easy.
“Far more money has been lost by investors preparing for corrections, or trying to anticipate corrections, than has been lost in corrections themselves.” – Peter Lynch.
Lets see if he was right…
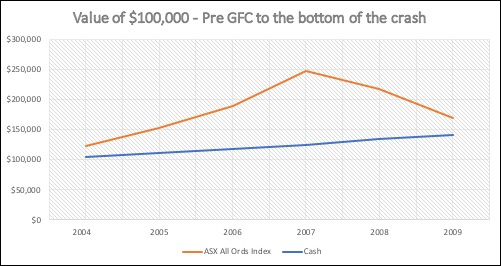
The following tables show the returns of an investor investing in 100% Australian stocks from 2004 – 2009 (and suffering the absolute worst of the GFC) vs the returns of an investor investing in 100% cash for the same period.
Australian Stock Market Returns
| Year | Start balance | Returns | End Balance |
| 2004 | $100,000 | 22.40% | $122,400 |
| 2005 | $122,400 | 24.70% | $152,633 |
| 2006 | $152,633 | 24.20% | $189,570 |
| 2007 | $189,570 | 30.30% | $247,010 |
| 2008 | $247,010 | -12.10% | $217,121 |
| 2009 | $217,121 | -22.10% | $169,138 |
international cash Returns
| Year | Start balance | Returns | End Balance |
| 2004 | $100,000 | 5.30% | $105,300 |
| 2005 | $105,300 | 5.60% | $111,197 |
| 2006 | $111,197 | 5.80% | $117,646 |
| 2007 | $117,646 | 6.40% | $125,176 |
| 2008 | $125,176 | 7.40% | $134,439 |
| 2009 | $134,439 | 5.50% | $141,833 |
There it is, after losing 12.1%, and then a further 22.1% in the GFC our stock market investor is still $27,305, or 19.25% better off than our cash investor at the deepest depths of the crash – and that was when interest from the bank was 6% on average!!! Imagine the same comparison on todays cash rate of 2%.
“My favorite time frame is forever.” – Warren Buffet
There is a pretty compelling case for being ‘fully invested’ through all of the lumps and bumps…. but you have to be rational, and you have to be able to stomach it.
Trying to ‘time the market’ is a mugs game – if people could accurately pick the tops & bottoms of the market we’d all be disgustingly wealthy. The reality is that trying to time the market usually means people move into cash too quickly (ie: pulling your cash out of the stock market in 2007 and missing out on 30.3% returns!) or putting it back in too late and missing the recovery (13.8% in 2010).
“I can’t recall ever once having seen the name of a market timer on Forbes’ annual list of the richest people in the world. If it were truly possible to predict corrections, you’d think somebody would have made billions by doing it.” – Peter Lynch
Now, so you know that i’m not “cherry picking” data – lets take a look at the worst possible scenario. Lets say our sharemarket investor has the worst timing in the world… they see everyone around them making money in 2004 – 2007…. the FOMO builds and they want piece of the action… they finally go ‘all in’ with a $100,000 investment straight into Aussie stocks right at the very peak of the market (remember Bitcoin mania in the tail end of 2017 anyone?).
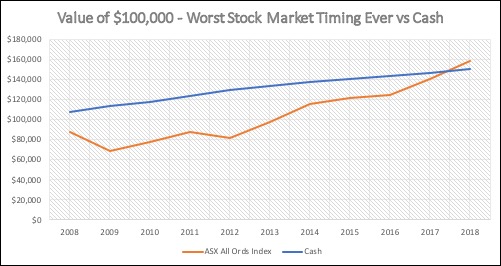
Well due to greed, FOMO, and the worst timing ever our stock market investor took a while to recover, but today is back ahead of the cash investor. Time & patience are your two best friends in investing.
Now this one is a shocker. What if our poorly timed investor was so badly burnt by his or her first foray into the stock market that they vowed off investing forever. After going through the second year of losses in 2009, they sold their entire investment portfolio and put all of the proceeds in the bank. This is what that looks like vs doing absolutely nothing.
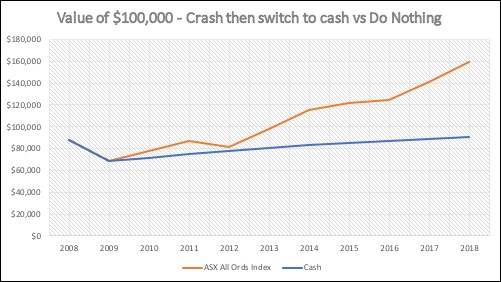
Its sad, but this graph above reflects the action of many people during the GFC. Their net worth still hasn’t recovered, where as it would be well in excess of where they started had they simply done nothing.
And for good measure, lets look at an initial investment of $100,000 in 2004, with regular additions of $10,000 per year every year.
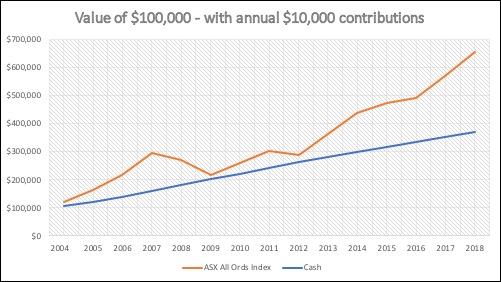
There is not one single point in time where you would have been better off remaining in cash the whole time – not one. To illustrate how much better off you are in the stock market, if the stock market investor in the graph above lost 40% tomorrow, they would still have $21,329 or 5.75% more than the cash in the bank investor!
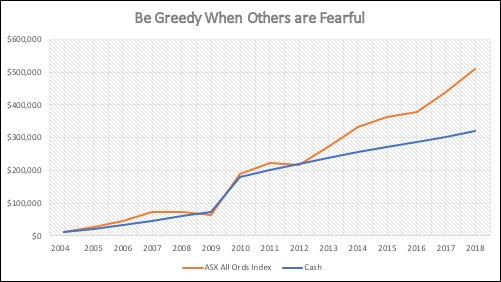
“And if they insist on trying to time their participation in equities, they should try to be fearful when others are greedy and greedy only when others are fearful” – Warren Buffet
And just for kicks, lets take uncle Warrens advice and see what happens if we had a regular investment of $10,000 starting in 2004, and then when the GFC hit we stopped, took pause, rationalised and thought “this is crazy, companies are now trading at massive discounts to their intrinsic value – time to buy up”. in 2009 we made a one off $100,000 investment, and then continued our regular $10,000 per year.
So, what kind of investor are you? Are you trying to time the market, predict the next crash, switch asset classes trying to chase returns (and hows that working out for you?), or are you a cool head who prefers to ride out the ups and downs of the market because you have a long-term focus?
Don’t wait till the next GFC hits to find out. Do some soul searching, and find out how you really feel about risk & return. Be prepared for what the future holds, but don’t let it keep you up at night. Have a plan and stick to it.
Invest in line with your risk profile, and regularly contribute. These are the hallmarks of the best investors – and with practice, support and discipline you can be one of them.