
….well, little tiny bits of them anyway.
I want to talk about buying companies….cause thats what we’re really doing when we buy ‘shares’, or ‘stocks’ – we are buying tiny little pieces of a company (along with a proportionate amount of its earnings, risk, debt, and potential). Unfortunately though, many people make a face value assessment of a ‘stock’ (and its value) based on its share price alone. For example, which company is better?
| Company A | Company B | |
| Share Price | $0.10 | $50.00 |
Duh, company B of course… its share price is 500 times higher than company A, right?
Ok then, well how many red buckets does it take to fill a pool with water, and how many blue buckets does it take?
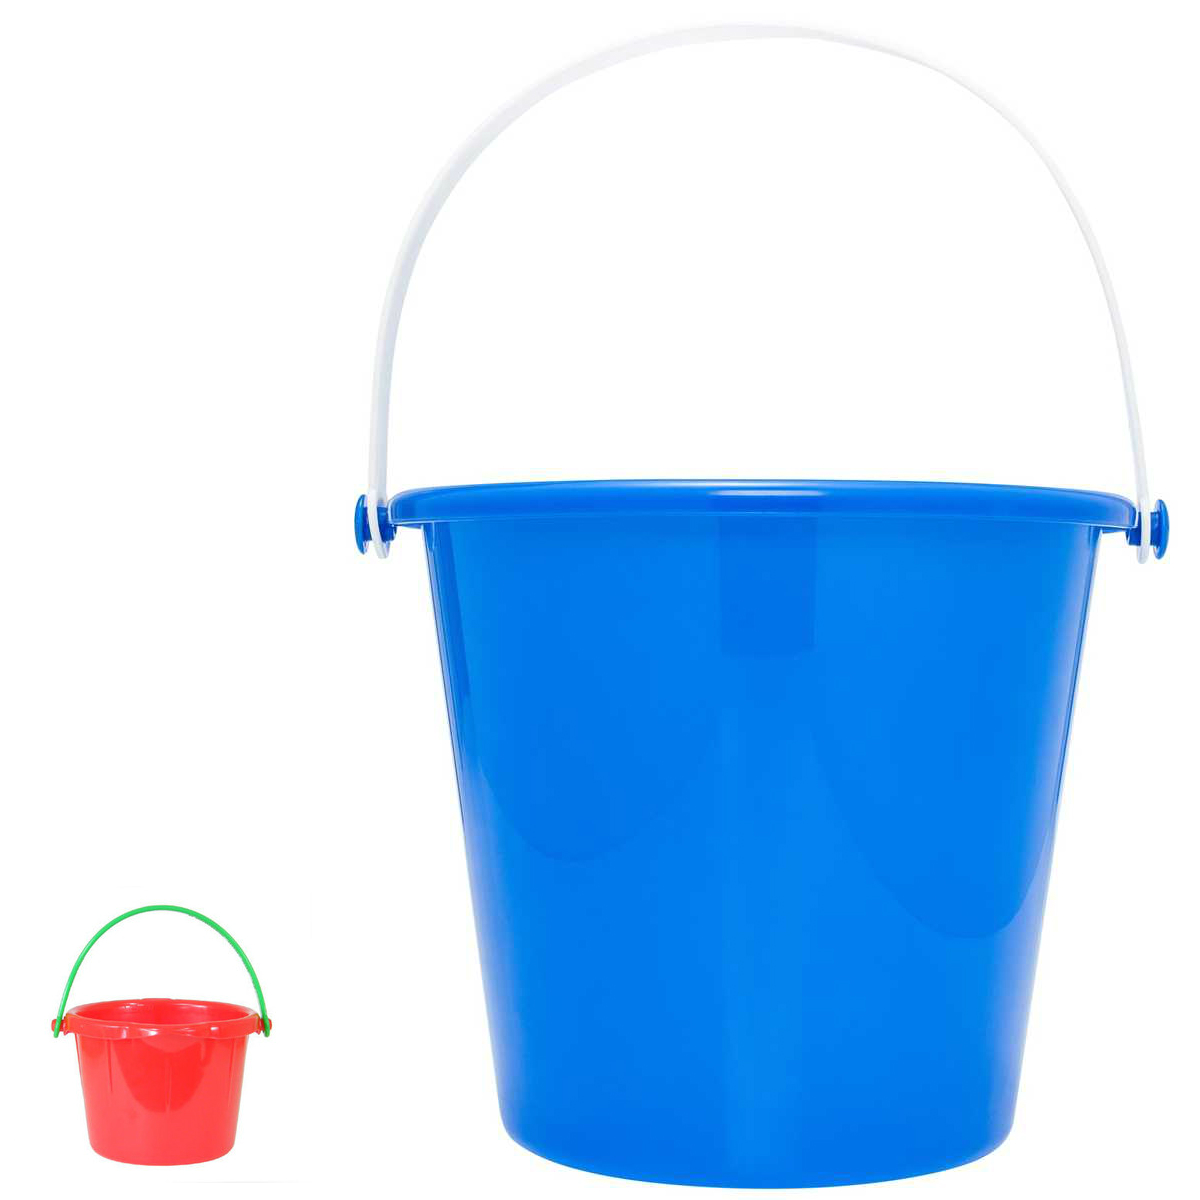
‘Hang on a minute’, i hear you say. Is it a baby pool, or an Olympic pool? Am i using the red bucket to fill the Olympic pool, or the baby pool?… now you’re starting to ask questions…You see, when it comes to valuing companies it is useless to try to value the share (bucket) until we value the company (pool).
A company’s market value is essentially the amount that investors are willing to pay for it. This value is called Market Capitalisation (abbreviated to Market cap, or MC). Market Cap is the share price of a company multiplied by the amount of shares on issue. Conversely, a share price is a company’s Market Cap divided by the amount of shares on issue.
| Company A | Company B | |
| Share Price | $0.10 | $50.00 |
| Shares on issue | 500,000,000 | 1,000,000 |
| Market Cap | $50,000,000 | $50,000,000 |
It turns out, because company A has many more shares on issue than company B, it has exactly the same Market Cap. Buying $50,000 worth of shares in either company would mean you own 0.1% of the company – regardless of the fact that you would own a vastly different amount of shares.
So now that we know that Market Cap is the price that ‘Mr Market’ is willing for pay for a company, but how has he arrived at this price? Has he just plucked it out of thin air, or is it anchored to something?
Well, in Australia, on average ‘Mr Market’ values a company at around 15-16x their company’s earnings (profit). This earnings multiple is referred to as a P/E Ratio. So if a company had NPAT of $20M and a P/E Ratio of 16, its market cap would be $20M x 16 = $320M. (*If you’re a property investor, think of NPAT as your rent, and Market Cap as the value of the property. A 5% rental yield would effectively be like a P/E ratio of 20).
*Its a little bit different, but works for the point of comparison.
For the historical PE of the entire stock market, check out http://www.marketindex.com.au/statistics
This ‘Market PE’ represents the amount that investors are willing to pay for each dollar of company earnings – you can see when the market start pulling their cash out of the bank and buying stocks, and when the market gets scared and returns their cash to the relative safety of their savings account.
Its important to note not all companies trade on a price to earnings ratio of 15-16. In fact (believe it or not) some companies listed on the stock exchange don’t even earn a single cent in revenue let alone profit – yet they have a market cap in the hundreds of millions, or even billions of dollars! So what compels Mr Market to pay 60, or 100, or 500 times earnings for a piece of ownership in these companies? The answer is growth – expectations of future profits.
So, whilst 16 x earnings may be a reasonable price to pay for a company growing profits in the mid single digits (say 5 – 7% per year), it may look very cheap if a company was expected to grow profits at 25 – 30% per year for the next 5 years. Conversely, it may be very expensive if the company’s earnings were expected to decline due to unfavourable business conditions (take a look at what has happened to retail stocks since the announcement that Amazon is coming to Australia).
To draw a parallel with property investing, properties in regional areas with limited growth prospects are usually cheaper, but have a higher rental yield, whereas properties in highly popular suburbs are typically more expensive, and have a lower rental yield.
Lets have a look at how a low P/E investment looks compared to a high P/E (growth) investment.
| Company X | Company Y | |
| Market Cap | $50.0 Million | $100.0 Million |
| Profits | $5.00 Million | $2.0 Million |
| P/E Ratio | 10 | 50 |
On face value we have company A, which is generating profits 2.5 times greater than company B, yet Mr Market is willing to pay twice as much for company B…. Why?? Has the market gone mad?
Well, not necessarily…
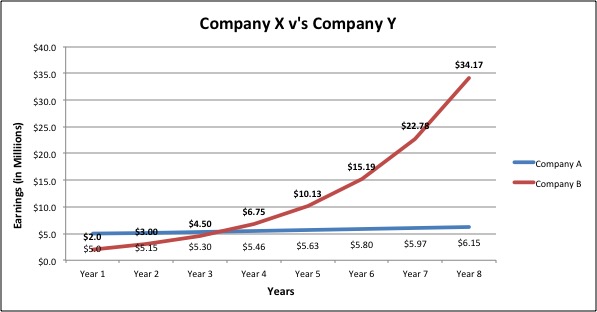
See, company B is expected to grow profits at 50% per year, whereas company A is ‘mature’, and is only expected to grow at 3%. If we assume that the Market Cap doesn’t change, in year 4, company B (whilst appearing expensive today) will be trading on a P/E Ratio of 14.81 ($100M / $6.75M). That’s pretty damn cheap for a company that is growing at 50% per year!
This massive difference in the prospects of the two companies makes it worth paying a bit extra for company B. Warren Buffet sums it up most eloquently (as he often does)…
“Price Is What you Pay,
Value is what you get”.
P/E ratios or rental yields give use a ‘quick & dirty’ means of assessing how cheap or expensive a prospective investment is but they are far from comprehensive and most certainly not recommended to use as the only means. The real trick is to work out the true underlying value of a company, and then compare it to the price that the market is selling it for. If it happens to be on sale for less than its intrinsic value, snap it up like bargains on a boxing day sale!
We’ll visit some of those other ways of assessing underlying, or ‘intrinsic value’ in the coming weeks, so be sure to check in. For now, i hope this quick look at Market Cap, P/E Ratios, and Growth prospects helps put some context around what it is you’re truly paying for when you buy shares in a company.
Happy Investing.